How to Get Amazon Sales Data for Market Research
Unlock valuable insights from Amazon sales data to enhance your market research, refine strategies, and stay ahead of competitors.

How to Get Amazon Sales Data for Market Research
Amazon sales data is a goldmine for understanding consumer behavior, tracking market trends, and analyzing competitors. With $638 billion in annual net sales, over 60% driven by independent sellers, this data helps businesses make informed decisions. From sales rank and revenue estimates to customer reviews and inventory trends, Amazon offers insights that can shape pricing, inventory, and marketing strategies.
Here’s how you can access and analyze this data:
- Amazon Product Advertising API: Provides product details, pricing, and reviews but lacks direct sales figures.
- Canopy API: Offers advanced metrics like sales estimates, stock levels, and real-time updates for deeper analysis.
- Best Practices: Automate data collection, monitor API usage limits, and ensure compliance with Amazon's terms of service.
Amazon Selling Partner API - how to get inventory and sales from Reports API and Sales API + graphs
What Amazon Sales Data Includes
Amazon’s marketplace churns out a wealth of data that goes far beyond basic purchase transactions. It captures insights into product performance, customer behavior, and market trends, offering a treasure trove for businesses conducting market research. This data spans sales rankings, revenue estimates, customer feedback, and inventory levels - shedding light on consumer preferences and emerging trends.
Important Data Points for Market Research
Amazon sales data is packed with valuable metrics, each offering a unique perspective on the market:
- Sales rank: This is one of the clearest indicators of how well a product is performing. It highlights high-demand items and tracks steady sales over time, offering insights into both enduring popularity and sudden demand spikes. Products with consistently low sales ranks typically reflect strong and stable market demand.
- Revenue estimates: These figures are essential for financial analysis. They include gross sales, monthly revenue projections, average daily orders, and unit prices. Such data helps businesses gauge market demand, uncover profitable opportunities, and refine competitive strategies.
- Customer reviews and ratings: These provide a direct line to consumer sentiment about a product. Positive reviews and high ratings enhance credibility and visibility, while detailed feedback reveals what customers appreciate and where improvements are needed.
- Inventory and stock levels: Supply chain health and demand trends can often be inferred from stock data. Frequent stockouts may indicate high demand or supply chain challenges, whereas overstocked items might suggest waning interest or overestimated demand.
- Search and keyword data: By analyzing how customers search for products, businesses can better understand consumer language and search behavior. This data plays a critical role in improving product visibility and optimizing marketing strategies.
How Sales Data Creates Business Insights
Amazon sales data is more than just numbers - it’s a tool for uncovering patterns and opportunities that drive smarter decisions. By analyzing this data, businesses can:
- Spot market trends: Tracking sales over time reveals seasonal patterns, emerging product categories, and shifting consumer preferences. These insights help with inventory planning, pricing strategies, and timing product launches for maximum impact.
-
Benchmark against competitors: Monitoring competitors’ sales volumes, pricing strategies, and customer feedback allows businesses to identify market gaps and refine their positioning. As Joanne Sullivan, Co-founder of Totally Bamboo, put it:
"We learned from our competition to stay ahead of it and not get overcome by it".
- Understand customer needs: Analyzing reviews and feedback helps businesses identify which product features resonate most with customers, uncover common complaints, and even spot opportunities for new product development.
- Assess market opportunities: Actual sales data provides a more accurate picture of the total addressable market for specific product categories. It also helps businesses understand price sensitivity and pinpoint the most profitable customer segments.
- Improve forecasting and planning: Historical sales data is invaluable for predicting future trends. By identifying long-term patterns and seasonal fluctuations, businesses can optimize inventory management, avoid stockouts during peak demand, and minimize excess inventory during slower periods.
Up next, we’ll explore how to access this data using APIs to supercharge your market research efforts.
How to Access Amazon Sales Data
Understanding Amazon sales data can be a game-changer for market research, but accessing it requires the right tools and strategies. While Amazon doesn't openly share detailed sales figures, there are ways to gather valuable insights using APIs and third-party services. Here's how you can get started.
Using the Amazon Product Advertising API
Amazon’s official Product Advertising API is a great starting point for pulling product-related data. It provides access to basic information like product details, pricing, customer reviews, and availability. However, it stops short of offering direct sales numbers or inventory specifics.
To use this API, you’ll need to set up an Amazon Associates account and obtain API credentials. This allows you to integrate product data into your workflow. While it’s not designed for deep sales analysis, it’s a helpful tool for tracking product catalogs and price trends.
Leveraging the Canopy API for Deeper Insights
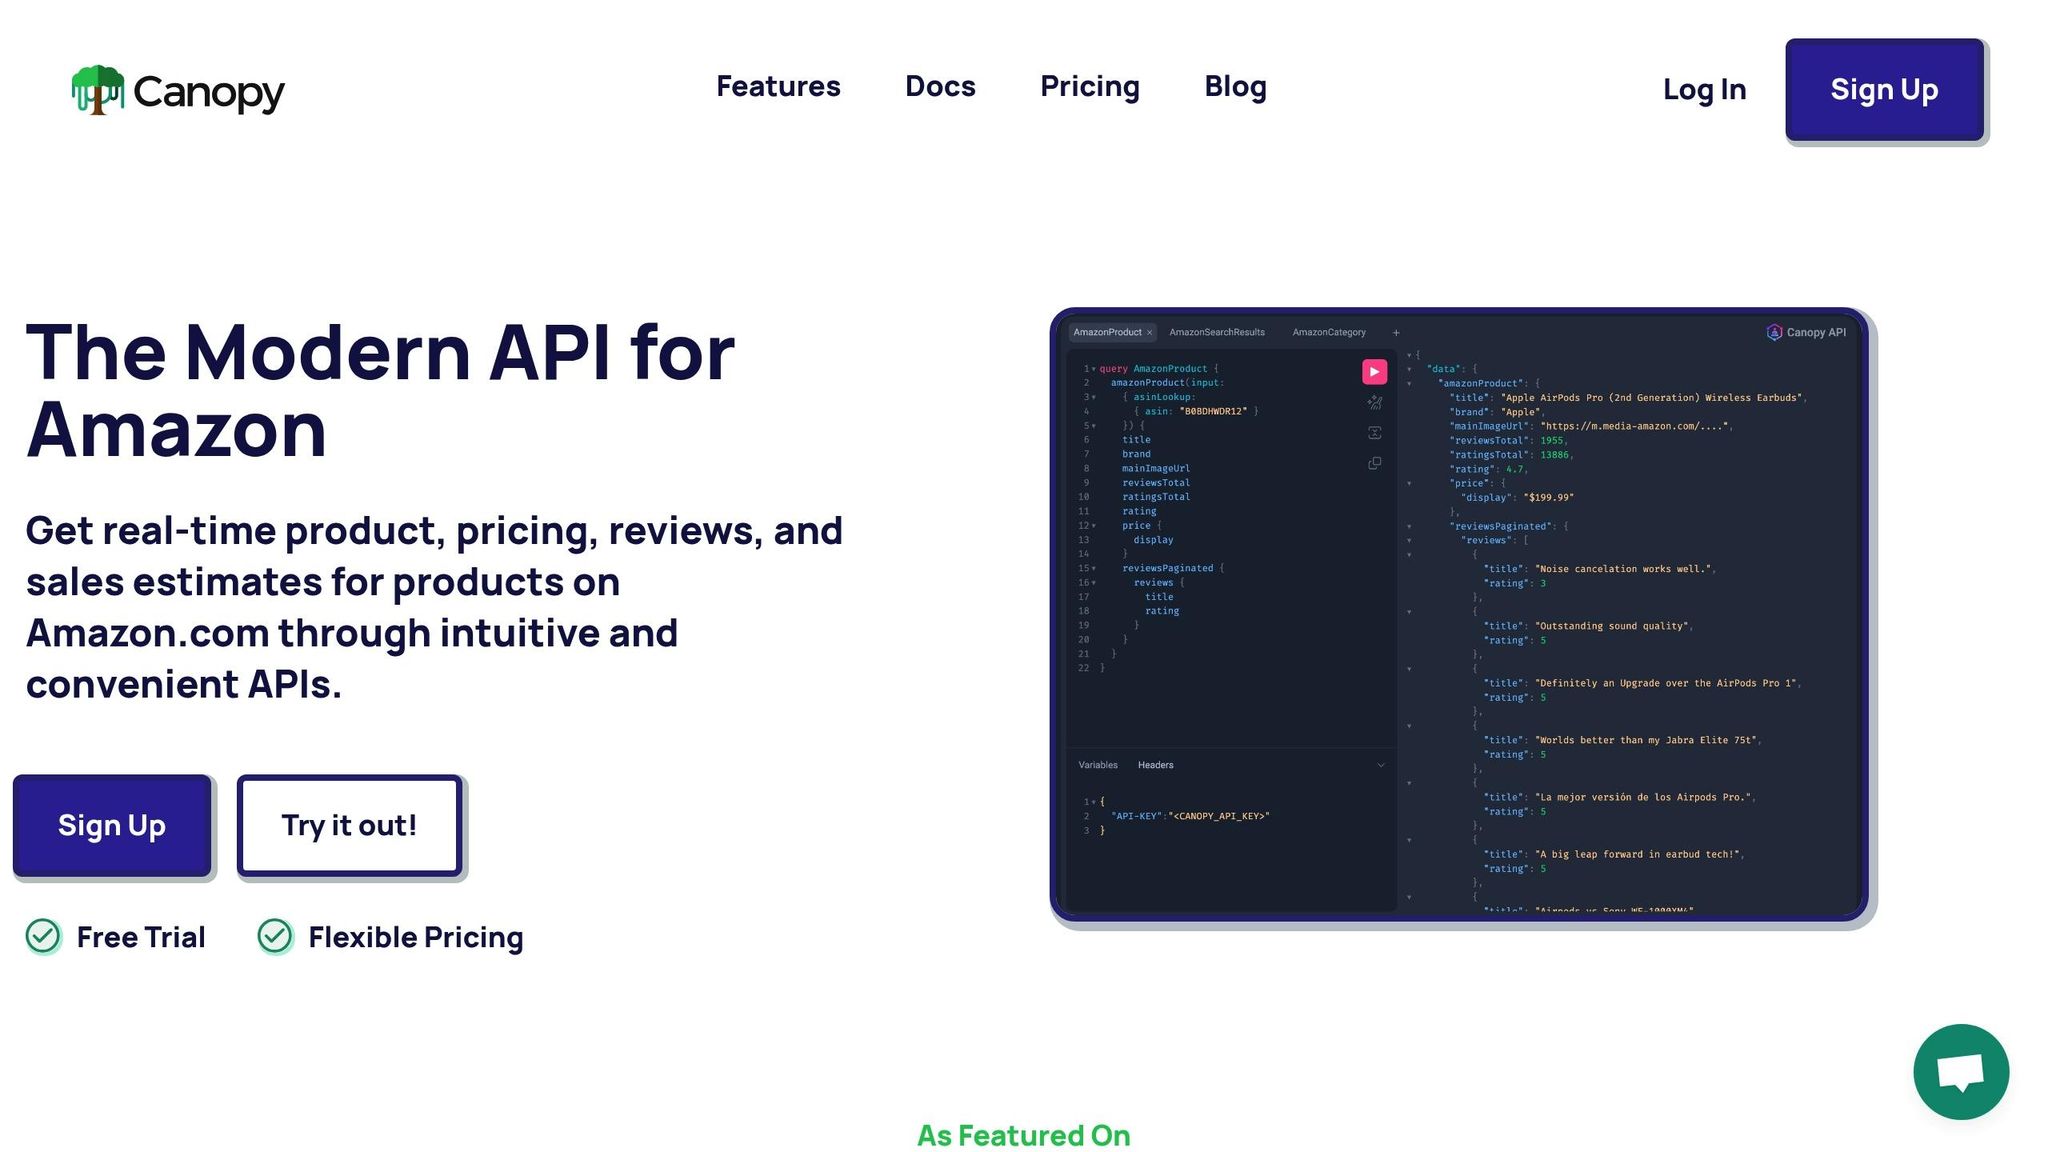
For more detailed market research, the Canopy API is a robust option. It offers real-time access to advanced data points like sales estimates, stock levels, and AI-driven insights. These features provide a clearer picture of market trends and demand.
To get started, sign up for a Canopy API account and retrieve your API key. The API supports both REST and GraphQL, giving you flexibility in how you integrate it. Key features include:
- AI-powered sales estimations (weekly, monthly, and yearly)
- Stock level monitoring
- Pricing data analysis
- Scalability with volume discounts for higher usage tiers
- Support for multiple international Amazon marketplaces, including the US, UK, Canada, Germany, and more
This makes Canopy API a powerful tool for businesses looking to analyze inventory patterns and market demand across global markets.
Staying Compliant with Legal and Data Policies
When working with Amazon sales data, it’s essential to follow all applicable terms of service and data usage policies. Official APIs, like the Product Advertising API, have rate limits and strict guidelines you must adhere to. Focus on analyzing aggregate market trends rather than individual user behaviors, and always document your data sources clearly.
If your research spans multiple countries or involves sensitive data, it’s wise to consult legal experts to ensure full compliance with international regulations. By staying within these boundaries, you can confidently use these methods to gather and analyze Amazon sales data effectively.
sbb-itb-d082ab0
How to Analyze Amazon Sales Data
Analyzing your Amazon sales data starts with transforming raw numbers into meaningful insights that can drive your business decisions. To do this effectively, you need to organize your data, focus on critical metrics, and present your findings clearly.
Organizing and Collecting Data
Begin by exporting reports from Amazon Vendor Central or Seller Central and storing them in an organized folder system. For smaller datasets, spreadsheets work well, but for larger-scale analysis, consider using SQL databases for secure and efficient querying.
Before diving into analysis, clean your data. This means removing duplicates, addressing missing values, and standardizing data formats. Automating these steps with scripts or ETL (Extract, Transform, Load) tools can save time, especially if you're working with real-time API updates.
It's also essential to validate your data. Check for completeness, identify outliers, and ensure your processes are functioning correctly. With clean and organized data, you're ready to uncover insights.
Key Metrics for Market Research
Once your data is prepared, focus on metrics that provide a clear picture of market dynamics:
- Sales velocity: Measure how fast your products sell by dividing total units sold by the time period. Tools like Canopy API can refine these estimates with projections over weekly, monthly, or yearly intervals.
- Price trends: Track price changes over time to identify seasonal demand shifts and competitive pricing strategies.
- Market share: Compare your sales volume to the overall category to estimate your share of the market.
- Stock levels: Monitor inventory alongside sales velocity to anticipate potential stockouts. Real-time tools like Canopy API can alert you to supply chain issues before they escalate.
- Customer feedback: Analyze average ratings and review volumes to gauge customer sentiment and identify areas for improvement.
Creating Charts and Dashboards
Visualization tools like Tableau and Power BI are excellent for turning large datasets into easy-to-understand charts and dashboards. Use these tools to highlight trends like sales growth, the relationship between price and volume, and seasonal patterns. For instance, AMZScout's PRO AI Extension analyzed the "dog bark collar" niche in 2025 and found consistent year-round sales with a slight uptick in spring - indicating a stable market without major seasonal risks.
When creating dashboards, focus on key performance indicators (KPIs) that align with your goals. High-level dashboards for executives should emphasize overall trends, while detailed dashboards for operational teams can break down metrics like inventory levels and customer reviews. Combining external tools with Amazon Seller Central's native dashboards ensures you have up-to-date numbers to guide your decisions.
Tailor your visualizations to your audience’s needs, whether you're presenting to stakeholders or guiding internal teams. Clear, actionable insights are the end goal.
Best Practices for Amazon Sales Data
To conduct reliable market research on Amazon, it’s essential to follow these best practices:
Managing API Rate Limits and Errors
Amazon's Product Advertising API has strict rate limits, which can disrupt data collection if not handled carefully. To avoid this, use exponential backoff: start with a 1-second delay between requests and gradually increase it. This approach prevents overwhelming the API. Additionally, limit retry attempts to avoid unnecessary delays.
Instead of making individual product calls, group your requests into batches and distribute them throughout the day. This method reduces the risk of hitting rate limits.
Make sure to closely monitor your API usage through Amazon's reporting dashboard. Setting up alerts as you approach your usage limits allows you to adjust your strategy in time.
For projects requiring higher data throughput, tools like Canopy API can simplify the process. Canopy’s advanced rate-limiting features automatically handle throttling and manage request queues intelligently, letting you focus on analyzing data rather than managing API constraints.
By implementing these strategies, you can ensure a steady and reliable data flow for your research.
Keeping Data Fresh and Accurate
Amazon’s marketplace is fast-moving, with prices and inventory levels changing constantly. Using outdated data can lead to poor decisions, so keeping your datasets current is critical.
Automate data refresh cycles to align with the speed of your market. For highly competitive categories, more frequent updates are essential. Tools like Canopy API offer real-time synchronization, automatically detecting and updating changes without requiring manual input.
Regularly validate your data to catch and fix inconsistencies quickly. Build data quality dashboards to monitor metrics like data freshness, completeness, and accuracy. Keeping an eye on factors like successful API call percentages and average response times can help you spot issues in your data pipeline early.
It’s also a good idea to store historical data alongside current information. This allows for trend analysis and helps you identify anomalies. Historical context is invaluable for distinguishing genuine market trends from potential data errors.
Staying up-to-date with accurate data collection practices not only improves decision-making but also ensures ethical standards are maintained.
Following Ethical Guidelines
Beyond managing APIs and ensuring data accuracy, adhering to ethical data practices is non-negotiable. Compliance with legal requirements is critical for responsible market research.
Focus on collecting and storing only aggregate sales data. Avoid gathering personal customer information, and if any personal data is required, ensure you have explicit consent.
Only collect data that is necessary for your research objectives. Transparency is key - clearly document your data collection practices, including what is collected, how it’s used, and how long it will be retained. This level of clarity is vital for regulatory compliance and building trust.
Finally, respect competitive boundaries. Avoid actions that could manipulate the marketplace or harm other sellers. By maintaining fair competition principles, your research can contribute to a balanced and thriving marketplace ecosystem.
Conclusion: Getting the Most from Amazon Sales Data
Amazon sales data is a treasure trove of insights into consumer habits, competitor strategies, and market dynamics. To unlock its full potential, you need a solid approach to gathering, analyzing, and managing this data, all while adhering to ethical guidelines.
Smart data collection is the first step. Amazon's Product Advertising API gives you access to product details, pricing, and basic metrics. Pairing it with tools like Canopy API takes things further, offering detailed sales estimates, stock levels, and real-time updates across multiple Amazon marketplaces. This combination equips you to track everything from individual product performance to broader category trends.
The value of your data lies in how you analyze it. Focus on metrics that align with your goals. Whether you’re identifying market gaps, monitoring competitor pricing, or spotting seasonal trends, the right analytical framework turns raw numbers into actionable insights. Automated dashboards can simplify this process, making it easier to adapt your strategies based on clear, data-driven conclusions.
Efficient data management is just as important. Strategies like rate limiting, automated refresh cycles, and quality monitoring ensure your data remains accurate and up-to-date. Canopy API simplifies this by automating much of the heavy lifting, allowing you to concentrate on interpreting the results.
Lastly, ethics and compliance should guide your approach. Respect Amazon’s terms of service, focus on aggregate data rather than personal information, and maintain transparency throughout your research. These practices not only protect your business but also contribute to a fair and balanced marketplace.
Businesses that treat Amazon sales data as an ongoing strategic resource can stay ahead of the competition. By combining smart data collection, sharp analysis, streamlined operations, and ethical practices, you’ll be well-positioned to make informed decisions - whether you’re launching a new product, breaking into a new market, or refining your current strategies in the ever-evolving world of e-commerce.
FAQs
What sales data does the Amazon Product Advertising API provide compared to the Canopy API?
Unfortunately, a detailed comparison between the Amazon Product Advertising API and the Canopy API isn't possible here, as specific details about the Canopy API aren't provided. That said, the Amazon Product Advertising API is known for delivering sales-related data like product pricing, availability, and customer reviews - valuable for tasks like market research. For more information about the Canopy API, it's best to consult its official documentation or related resources.
How can businesses stay compliant with Amazon's terms of service when using APIs to collect sales data?
To ensure compliance with Amazon's terms of service when using their APIs to gather sales data, it's crucial to thoroughly review and follow the guidelines provided in Amazon's API documentation, such as the Amazon Product Advertising API or other relevant agreements.
Stick to approved uses of the data, steer clear of unauthorized data scraping, and honor restrictions on how data can be stored or shared. It’s also wise to routinely check for updates to Amazon’s policies to maintain compliance. Failing to follow these rules could lead to penalties or even losing access to Amazon’s API services.
What are the best ways to visualize Amazon sales data for meaningful market research insights?
To make sense of Amazon sales data and turn it into actionable insights, rely on visual tools like charts, graphs, and dashboards. These formats simplify complex information, making trends and patterns easier to spot.
Pay special attention to key metrics like conversion rate, average order value (AOV), and return rate. These numbers are essential for evaluating performance and understanding what’s working - or what needs improvement.
Structure your data to reveal trends over time, compare different product categories, or measure your performance against competitors. Using clear and visually appealing formats can help you uncover opportunities, tackle challenges, and make smarter, data-driven decisions for market research.