Real-time Amazon Search Rankings with Canopy
Stay competitive on Amazon with real-time ranking insights from Canopy API, enabling quick adjustments to boost visibility and sales.
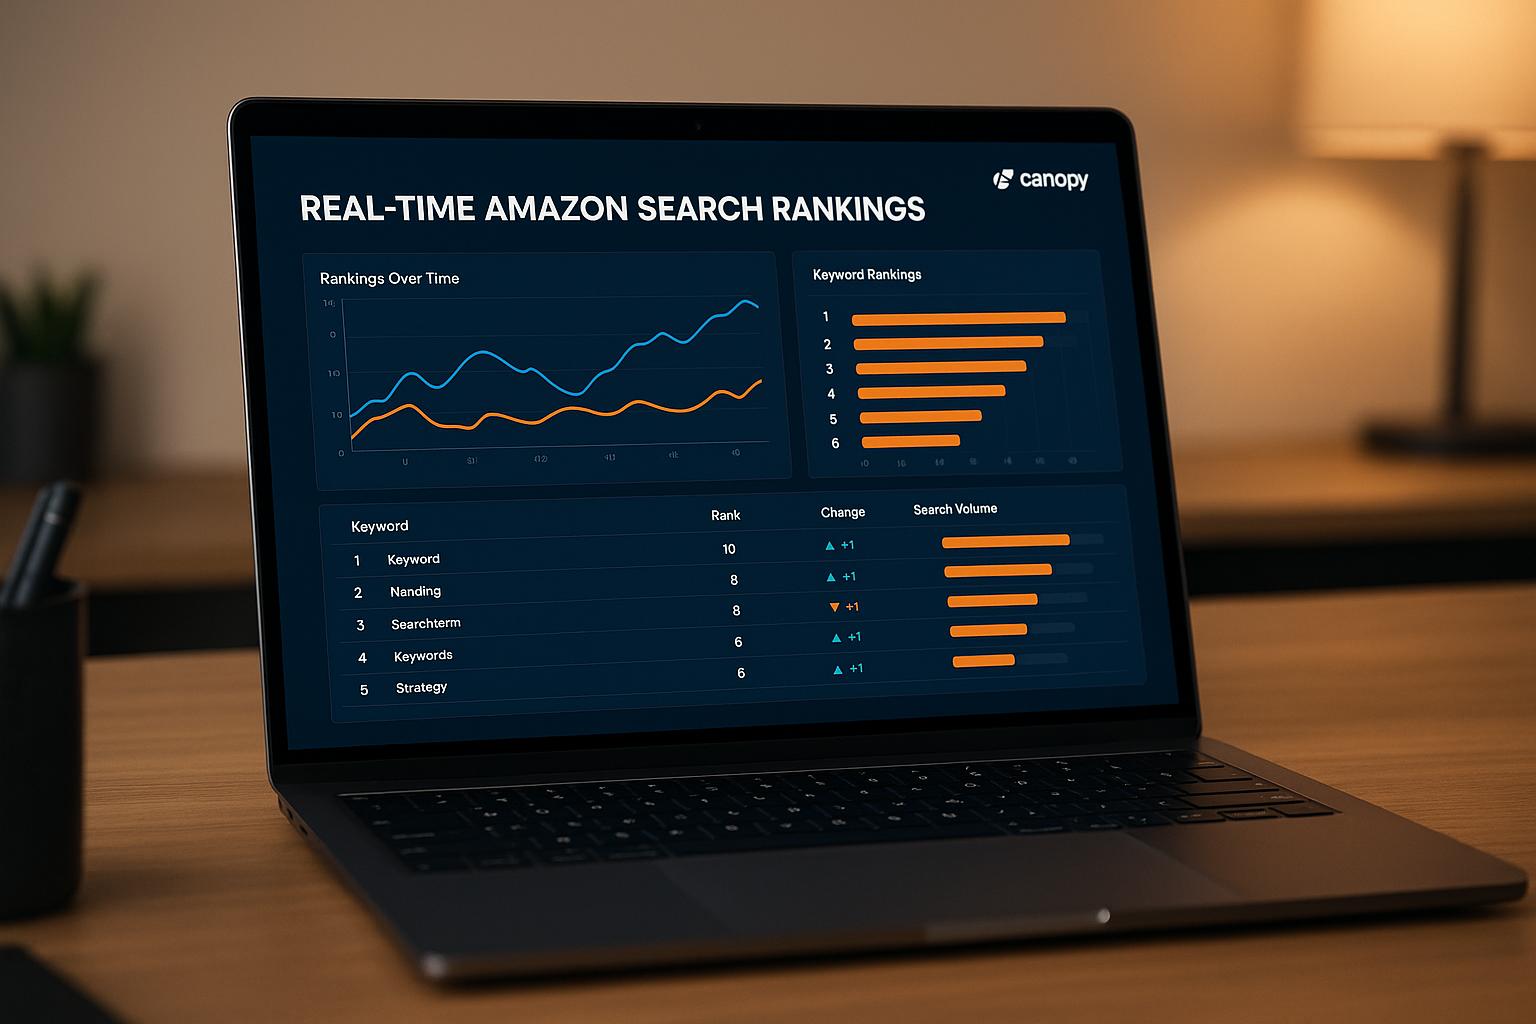
Real-time Amazon Search Rankings with Canopy
Amazon search rankings change constantly based on factors like customer behavior, pricing, and stock levels. This means a product’s rank can shift multiple times a day, making real-time data critical for staying competitive. Canopy API provides live ranking insights, helping businesses adjust their strategies quickly to boost visibility, sales, and market position.
Key Highlights:
- Why Real-Time Data Matters: Spot ranking changes instantly and respond to competitor moves, pricing shifts, or inventory trends.
- Canopy API Features:
- REST & GraphQL Endpoints: Access live ranking data tailored to your needs.
- Advanced Filters: Refine rankings by price, category, and product condition.
- Global Support: Track rankings across major Amazon marketplaces.
- Scalable Pricing: Free plan (100 requests/month) to pay-as-you-go ($0.01/request).
- Getting Started: Easy integration with programming languages like Python, JavaScript, and .NET.
- Use Cases:
- Optimize ad campaigns during peak ranking times.
- Prevent stockouts by monitoring ranking surges.
- Balance pricing to maintain profitability and visibility.
With Canopy API, businesses can track, analyze, and act on Amazon ranking data in real time, tailoring strategies to maximize sales and stay ahead of competitors.
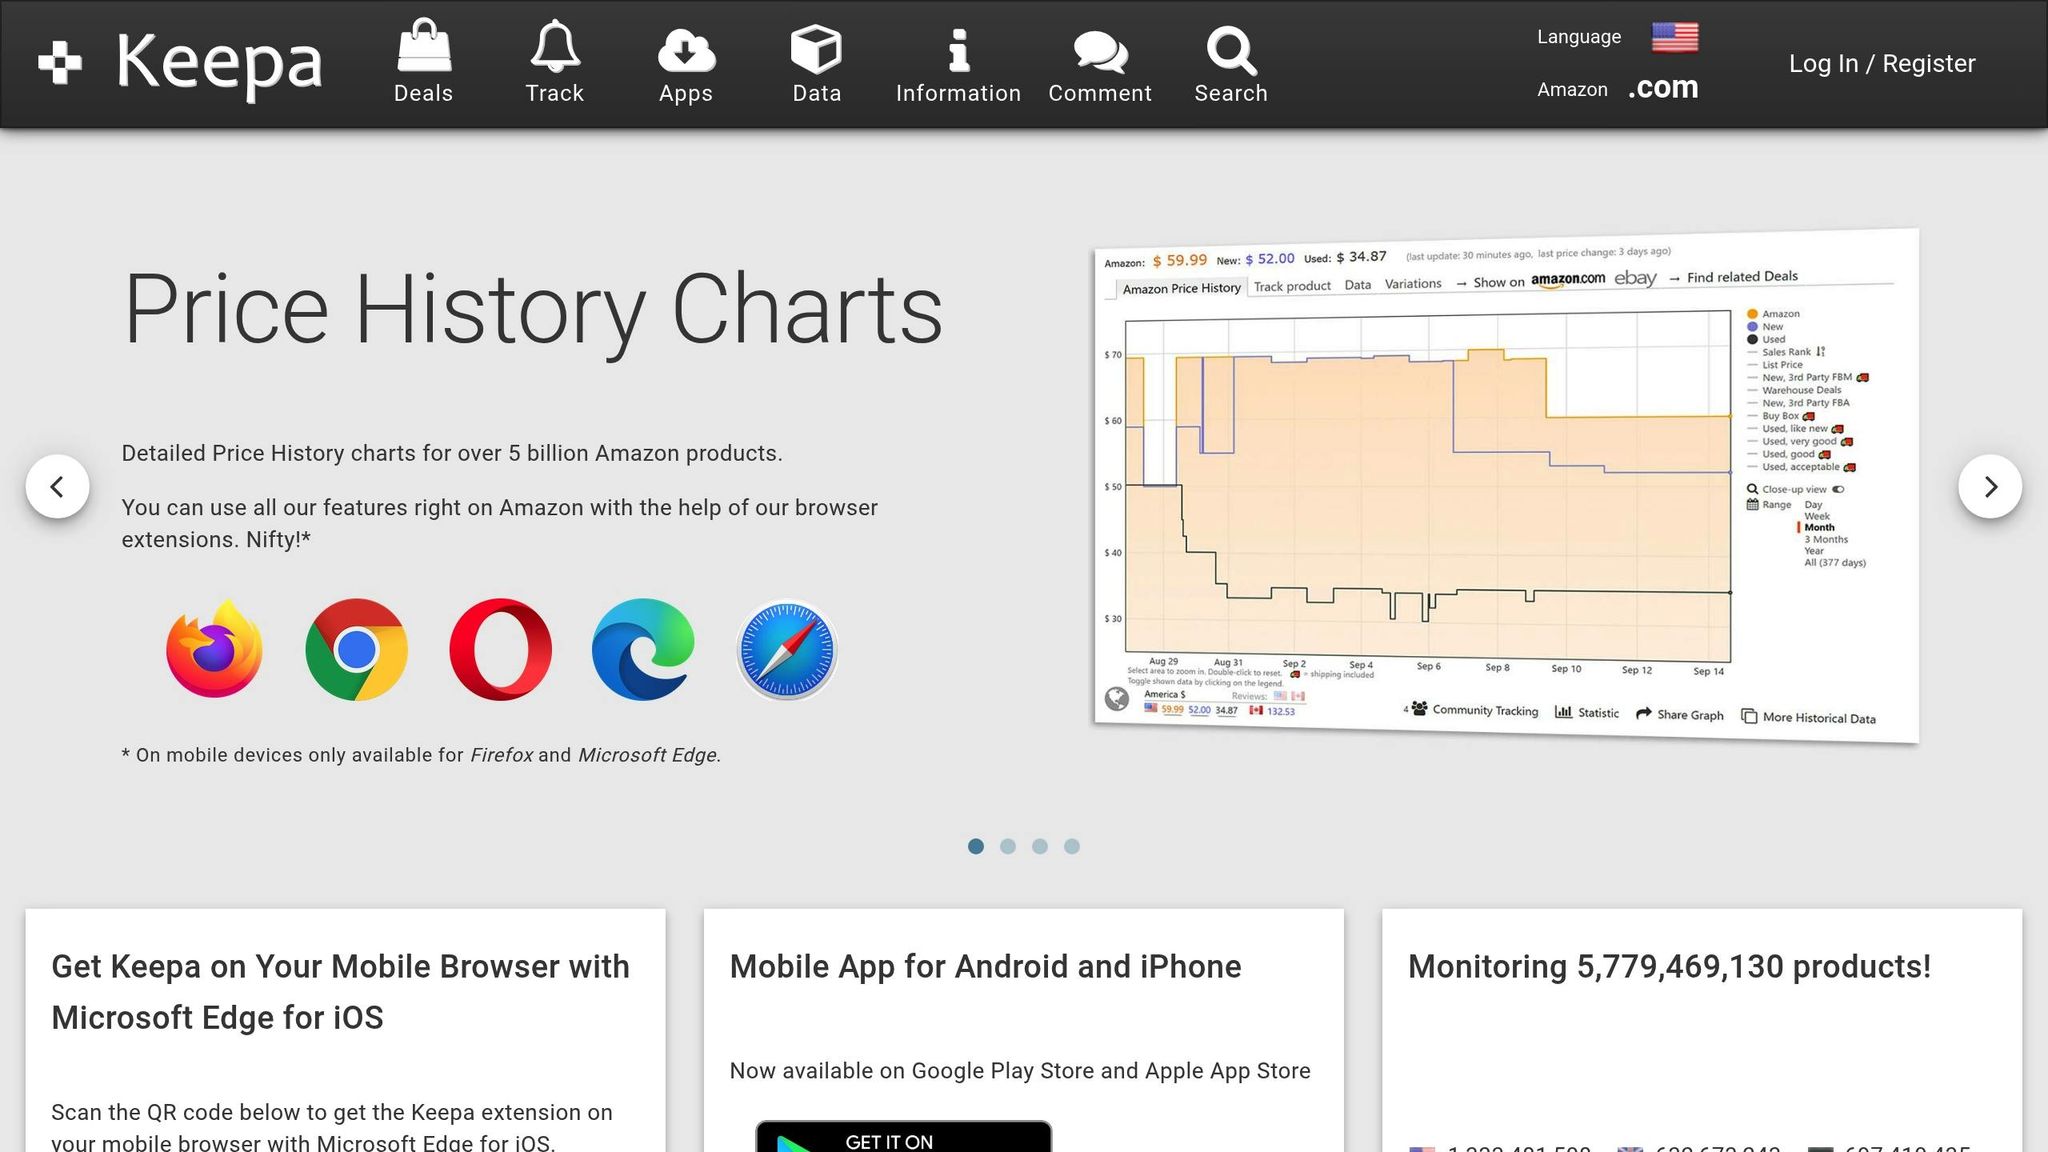
Keepa Tutorial | Understanding Sales Rank, Buy Box, Amazon Price, New Price, and Sub-category Ranks!
Getting Started with Canopy API
You can start using the Canopy API by creating an account, setting up your development environment, and familiarizing yourself with its endpoints. Here's how to get started.
Setting Up Your Development Environment
First, choose the programming language and framework you're most comfortable with. Since the Canopy API works with any language capable of making HTTP requests, the choice is yours.
For Python developers, the requests library is ideal for REST API calls, while gql works well for GraphQL. To handle U.S. currency formatting, use Python's locale module:
import locale
locale.setlocale(locale.LC_ALL, 'en_US.UTF-8')
This ensures numbers and currency values are displayed in the correct format for U.S. users.
JavaScript and Node.js developers can use fetch for REST calls or Apollo Client for GraphQL. To format dates in the MM/DD/YYYY format, leverage the Intl API:
const formatter = new Intl.DateTimeFormat('en-US', {
  month: '2-digit',
  day: '2-digit',
  year: 'numeric'
});
For .NET applications, configure the culture settings to automatically apply U.S. formatting standards, including currency symbols, decimal points, and number grouping.
While most developers start with REST endpoints because they are simpler to implement, GraphQL is a great choice for more complex queries. REST is often sufficient for tasks like ranking monitors, while GraphQL shines in scenarios requiring advanced analytics.
Once your environment is ready, the next step is securing your API key.
Authentication and API Key Setup
To get started, sign up at canopyapi.co and grab your API key from the dashboard.
Store your API key securely to avoid exposing it in your source code. Use environment variables for added security:
export CANOPY_API_KEY="your_api_key_here"
When making requests, include the API key in the API-KEY header for both REST and GraphQL endpoints:
curl -H "API-KEY: your_api_key_here" \
     "https://rest.canopyapi.co/api/amazon/search?searchTerm=wireless+headphones"
Your API key not only authenticates your requests but also tracks usage against your plan's limits. The free Hobby plan gives you 100 requests per month, while paid plans offer higher limits, including options for 10,000 and 100,000 requests.
To confirm your setup, perform a test API request. If authentication fails, you'll receive a 401 error with a detailed message to help you resolve the issue.
With authentication in place, you're ready to start capturing live data from Canopy API.
Using Base Endpoints
The Canopy API offers two main endpoints for accessing Amazon data in real time. The REST endpoint at https://rest.canopyapi.co/ is great for standard HTTP requests, while the GraphQL endpoint at https://graphql.canopyapi.co/ is perfect for precise, customized data queries.
REST endpoints use predictable URL patterns. For example:
/api/amazon/searchretrieves search rankings./api/amazon/productfetches details for a specific product.
These endpoints accept various parameters and return JSON responses formatted for U.S. businesses. For example, prices include dollar signs and proper decimal points (e.g., $19.99), and dates follow the MM/DD/YYYY format. Here are some key parameters for the search endpoint:
searchTerm: The keyword you're tracking.domain: Defaults to "US" for Amazon.com.page: For paginated results.sort: Determines ranking order (e.g., FEATURED, PRICE_ASCENDING).
GraphQL endpoints allow you to request only the data you need, making them more efficient for complex applications. For example, instead of fetching full product details, you can request just the titles, prices, and rankings. Here's a basic GraphQL query for search rankings:
query SearchRankings($searchTerm: String!) {
  amazonProductSearchResults(input: {searchTerm: $searchTerm, domain: US}) {
    productResults {
      results {
        title
        asin
        price {
          display
          value
        }
        rating
      }
    }
  }
}
Both endpoints return data formatted for U.S. standards, so you can focus on building your application without worrying about additional formatting.
With your environment set up and authentication confirmed, you're ready to start constructing effective API requests.
Retrieving Real-Time Amazon Search Rankings
Once your environment is set up and your API key is active, you can start pulling live Amazon search rankings. This process involves crafting precise requests, handling the responses, and organizing the data into a format that supports your business needs.
Building an API Request
Creating an effective API request requires including the right parameters. For example, the searchTerm parameter focuses on specific keywords, and the order of those keywords can influence the rankings you get.
Price filtering is another useful tool. By using the minPrice and maxPrice parameters, you can target products within a specific price range. For instance, setting minPrice=50 and maxPrice=200 limits results to products priced between $50.00 and $200.00 - perfect for narrowing down to mid-range options.
To refine results further, you can filter by category using the categoryId parameter. This ensures you're tracking rankings within a particular Amazon category, such as Electronics. You can find the available category IDs by querying the /api/amazon/categories endpoint.
The sort parameter allows you to control the ranking order. Here are the available options:
FEATURED(default): Amazon's algorithm-driven resultsPRICE_ASCENDING: From lowest to highest pricePRICE_DESCENDING: From highest to lowest priceAVERAGE_CUSTOMER_REVIEW: Products with the highest ratings appear first
You can also use the page parameter to navigate through multiple pages of results.
Here’s an example of how these parameters come together in a REST request:
curl -H "API-KEY: your_api_key_here" \
"https://rest.canopyapi.co/api/amazon/search?searchTerm=wireless+headphones&minPrice=50&maxPrice=200&sort=FEATURED&page=1"
This setup ensures you get the most relevant data for your needs.
Sample API Request and Response
Take, for example, a REST request to search for a "gaming mouse" with specific filters:
curl -H "API-KEY: your_api_key_here" \
"https://rest.canopyapi.co/api/amazon/search?searchTerm=gaming+mouse&minPrice=25&maxPrice=100&sort=FEATURED&limit=5"
The response provides JSON data with detailed product information:
{
  "data": {
    "amazonProductSearchResults": {
      "productResults": {
        "results": [
          {
            "title": "Logitech G502 HERO High Performance Wired Gaming Mouse",
            "asin": "B07GBZ4Q68",
            "url": "https://www.amazon.com/dp/B07GBZ4Q68",
            "price": {
              "symbol": "$",
              "value": 49.99,
              "currency": "USD",
              "display": "$49.99"
            },
            "mainImageUrl": "https://m.media-amazon.com/images/I/61mpMH5TzkL._AC_SL1500_.jpg",
            "rating": 4.6,
            "ratingsTotal": 89543,
            "isPrime": true,
            "sponsored": false
          },
          {
            "title": "Razer DeathAdder V3 - Wireless Gaming Mouse",
            "asin": "B0B1LW34GB",
            "price": {
              "display": "$89.99"
            },
            "rating": 4.4,
            "ratingsTotal": 12847,
            "isPrime": true,
            "sponsored": true
          }
        ],
        "pageInfo": {
          "currentPage": 1,
          "totalPages": 15,
          "hasNextPage": true,
          "hasPrevPage": false
        }
      }
    }
  }
}
This response includes key details like product titles, ASINs (Amazon's unique identifiers), pricing, customer ratings, and Prime eligibility. It also highlights whether a product is sponsored, helping you differentiate between organic and paid placements. Pagination data in the pageInfo section indicates there are 15 pages of results, making it easier to track rankings comprehensively.
For GraphQL requests, you can specify only the fields you need, which makes the response more concise:
query SearchRankings($searchTerm: String!, $minPrice: Float, $maxPrice: Float) {
  amazonProductSearchResults(
    input: {
      searchTerm: $searchTerm
      refinements: {
        priceRange: { min: $minPrice, max: $maxPrice }
      }
    }
  ) {
    productResults {
      results {
        title
        asin
        price {
          display
          value
        }
        rating
        ratingsTotal
        sponsored
      }
      pageInfo {
        currentPage
        totalPages
        hasNextPage
      }
    }
  }
}
This approach ensures you get only the information you need, reducing unnecessary data clutter.
Formatting Ranking Data for U.S. Businesses
To make the raw API data actionable, you’ll need to organize it into a format that supports decision-making. For example, since the products in the response are ordered, you can assign ranking positions based on their order in the array: the first product is #1, the second is #2, and so on.
Ratings can be presented in a user-friendly format like "4.6 stars (89,543 reviews)" to provide immediate clarity on a product's quality and popularity.
When visualizing rankings, simple indicators like "#1", "#2", "#3" make it easier to grasp the data. Here’s a Python example to process and format ranking data:
def format_ranking_data(api_response, search_term):
    results = api_response['data']['amazonProductSearchResults']['productResults']['results']
    formatted_rankings = []

    for index, product in enumerate(results):
        ranking_position = index + 1

        formatted_product = {
            'search_term': search_term,
            'ranking_position': f"#{ranking_position}",
            'title': product['title'][:50] + "..." if len(product['title']) > 50 else product['title'],
            'asin': product['asin'],
            'price_formatted': product['price']['display'],
            'price_numeric': product['price']['value'],
            'rating_display': f"{product['rating']} stars ({product['ratingsTotal']:,} reviews)",
            'is_sponsored': "Sponsored" if product['sponsored'] else "Organic",
            'prime_eligible': "Prime" if product['isPrime'] else "Standard"
        }
        formatted_rankings.append(formatted_product)

    return formatted_rankings
For time-based tracking, use the MM/DD/YYYY format to clearly log updates. For example, "Rankings updated: 11/04/2025 at 2:30 PM EST" provides clear context for users in the U.S.
Finally, showing percentage changes in rankings helps highlight trends. For instance, if a product moves from #8 to #5, you could display this as "Improved 37.5% (moved up 3 positions)." This kind of detail makes it easy to monitor performance shifts at a glance.
sbb-itb-d082ab0
Improving and Monitoring Amazon Search Rankings
Once you've set up your API and can pull ranking data, the next step is to fine-tune your approach and establish a system for ongoing monitoring. Success hinges on using advanced filters, maintaining a consistent tracking schedule, and extracting meaningful insights. These steps build on your initial setup, enabling you to evaluate rankings continuously.
Refining Search Queries with Filters
To get more precise data, refine your API queries with filters that focus on key ranking signals. The conditions parameter, for instance, is vital for analyzing performance across different market segments.
If you're selling refurbished electronics, you can track both new and renewed products in the same search. This helps uncover pricing gaps and new positioning opportunities.
curl -H "API-KEY: your_api_key_here" \
"https://rest.canopyapi.co/api/amazon/search?searchTerm=laptop&conditions=NEW,RENEWED&minPrice=300&maxPrice=800&sort=FEATURED"
Filtering by category is another essential step, especially if your products compete in multiple Amazon categories. By using the categoryId parameter, you can focus on rankings within the most relevant category, eliminating distractions from unrelated products in broader searches.
Sorting options also provide new perspectives. Many U.S. shoppers sort by price or reviews, so understanding how your product ranks under these filters is critical. For example, combining minPrice and maxPrice with a review-based sort could reveal that while your product ranks #15 in featured results, it climbs to #3 in customer reviews. That insight highlights strengths like product quality, which you can emphasize in your marketing.
Tracking Rankings Over Time
Once your queries are optimized, it's important to monitor rankings regularly. Establish a schedule for API requests that balances frequency with cost efficiency. Most businesses find that running checks every 6 to 12 hours provides sufficient detail without exceeding rate limits.
When storing historical data, use standardized date formats for consistency. This is especially useful when analyzing long-term trends.
import schedule
import time
from datetime import datetime

def track_rankings():
    timestamp = datetime.now().strftime("%m/%d/%Y %I:%M %p EST")

    # API request logic here
    ranking_data = get_current_rankings("wireless earbuds")

    # Store with consistent formatting
    store_ranking_data({
        'timestamp': timestamp,
        'search_term': "wireless earbuds",
        'rankings': ranking_data
    })

# Schedule tracking every 8 hours
schedule.every(8).hours.do(track_rankings)
Tracking how rankings shift over time helps you spot patterns. For instance, products that hold steady between #3 and #5 face different competitive dynamics than those fluctuating between #1 and #15. This information can reveal seasonal trends, promotional impacts, or changes in Amazon's algorithm.
For U.S. businesses, it's particularly useful to focus on key shopping periods like Black Friday, Prime Day, or back-to-school season. Rankings often behave differently during these times, requiring tailored analysis and adjustments.
Using Insights for E-Commerce Success
The true value of ranking data lies in identifying actionable opportunities. For example, analyzing sponsored vs. organic rankings can guide your advertising strategy. If your product ranks #8 organically but competitors dominate sponsored spots #1-#3, increasing ad spend during peak hours could improve visibility.
Price positioning is another area where ranking data proves useful. If your product consistently ranks between #12 and #15 but falls in the middle of the price range for top-ranked items, the issue might not be pricing. Instead, focus on other factors like reviews, images, or listing optimization.
Tracking review velocity can also predict ranking changes. Products with strong rankings but declining review rates are at risk of slipping. Monitoring the ratingsTotal field over time helps you address potential issues before they impact sales.
Competitor analysis is another key benefit of ranking data. If a competitor's product suddenly jumps from #8 to #2, examining their strategy - whether it's improved pricing, new features, or better listings - can offer valuable lessons to apply to your own products.
Seasonal trends also play a role. For instance, fitness equipment often ranks higher in January and May, while outdoor gear peaks in the spring. Recognizing these patterns helps you plan inventory and promotional campaigns more effectively.
The most successful businesses use ranking data to automate responses. For example, if a product drops below #10, your system could automatically increase ad bids, notify the marketing team, or adjust pricing to prevent further losses.
Lastly, combining ranking data with sales performance can uncover hidden opportunities. Products that rank well but convert poorly might have targeting issues, while lower-ranking products with strong conversions could benefit from increased visibility. Feeding these insights back into your API queries creates a continuous cycle of improvement and decision-making.
Integrating Canopy API for Business Applications
Incorporating Canopy API data into your dashboards, analytics tools, and automated systems can empower your business with real-time insights. By leveraging the ranking retrieval techniques mentioned earlier, these integrations can transform raw data into actionable strategies across your organization.
Building Dashboards with Real-Time Data
Dashboards are most effective when they present key metrics - such as rankings, price positioning, competitor analysis, and trends - in a way that encourages quick decision-making.
When designing dashboards with Canopy API data, focus on visuals that emphasize shifts and opportunities. For example, a ranking chart that shows your product's position over the past 30 days provides instant clarity on performance trends. Overlaying competitor pricing data on this chart can highlight when pricing adjustments might be necessary.
If your business manages a wide range of products, consider using category-based views. By organizing data by product line or market segment, you can quickly identify which areas are thriving and which need attention. For instance, pulling data for specific search terms and grouping results by category can reveal underperforming segments that require immediate action.
Set up real-time alerts for critical ranking changes. For example, if a product drops from the top 10 to position 15, automated notifications can prompt timely responses, such as adjusting prices, increasing ad spend, or checking inventory levels before the issue escalates.
It's also helpful to tailor dashboards to specific roles within your organization. Marketing teams may prioritize ranking trends and competitor insights, while inventory managers benefit from stock level alerts and sales velocity data. Product managers, on the other hand, might need a comprehensive view combining rankings, reviews, and pricing data.
Finally, ensure that your dashboards align with U.S. formatting standards, using USD pricing (e.g., $1,234.56), MM/DD/YYYY date formats, and timestamps in EST or PST.
Best Practices for API Integration
To ensure smooth integration with the Canopy API, focus on maintaining data accuracy and system performance.
A key consideration is balancing real-time data access with system efficiency and cost. While the Canopy API supports real-time updates, it’s crucial to set an appropriate request frequency. Many businesses find that checking rankings every 6–12 hours strikes a good balance, offering enough detail for decision-making without overloading systems or incurring excessive costs.
Your request schedule should reflect your business needs. High-competition categories may require more frequent updates, while stable product lines can be monitored less often. Dynamic scheduling during peak shopping events like Black Friday or Prime Day can also enhance responsiveness.
Error handling is another critical factor. Network timeouts, rate limits, or temporary service disruptions can interrupt data flow. Implement retry logic with exponential backoff and fallback procedures to manage these issues effectively.
Data formatting should remain consistent for U.S. audiences. Use proper USD pricing formats, decimals for prices, local time zone timestamps, and MM/DD/YYYY dates. Additionally, validate data at multiple integration points. For example, ensure ASIN values match expected formats, confirm price data is within reasonable ranges, and flag unusual ranking changes for manual review. These checks help catch potential issues before they impact critical decisions.
Caching can also improve performance and reduce API costs. By storing frequently accessed data locally and refreshing it on a set schedule, you can deliver faster responses to dashboard users while minimizing unnecessary API calls.
Comparing Product Performance Over Time
While real-time monitoring is essential, historical comparisons can uncover deeper trends and strategic insights.
Using standardized comparison tables, you can identify patterns that single data points might miss. These tables should include key metrics like search terms, dates, rankings, prices (in USD), and review counts. For example, tracking rankings over several months can reveal seasonal trends, such as fitness equipment performing better in January or outdoor gear gaining traction in the spring.
Highlight significant changes with conditional formatting or automated alerts. A product dropping from position 3 to position 12 within two weeks might require urgent action, while a gradual shift from position 8 to position 10 may indicate a less pressing issue.
Benchmarking against competitors adds valuable context. If your product experiences a ranking drop, comparing it to competitors can clarify whether the issue is specific to your product or part of a broader market trend. For instance, if all products in a category see declines, external factors like seasonality may be at play.
To prioritize efforts across large product catalogs, consider creating performance scorecards. For example, a product ranked #5 with growing reviews and competitive pricing might deserve more attention than a #3 product with declining reviews and higher prices. These composite scores can help focus your resources where they’re needed most.
Time-based comparisons are even more insightful when paired with external context. Recording events like promotional campaigns, inventory changes, or major market shifts alongside ranking data allows you to distinguish between temporary fluctuations and more significant issues that require a strategic response.
Finally, generate weekly and monthly summary reports to uncover long-term trends that daily monitoring might miss. For example, products showing steady improvement over several weeks signal successful optimization efforts, while gradual declines might suggest the need for updates to listings, pricing, or promotions.
Conclusion and Key Takeaways
Keeping track of Amazon search rankings in real time is a game-changer for e-commerce businesses aiming to stay ahead of the competition. This capability lets companies monitor product positions, pricing updates, and competitor activity as they happen, empowering smarter decisions that drive sales and market share. Let’s break down the standout features of Canopy API and how it simplifies this process.
Recap of Canopy API's Benefits
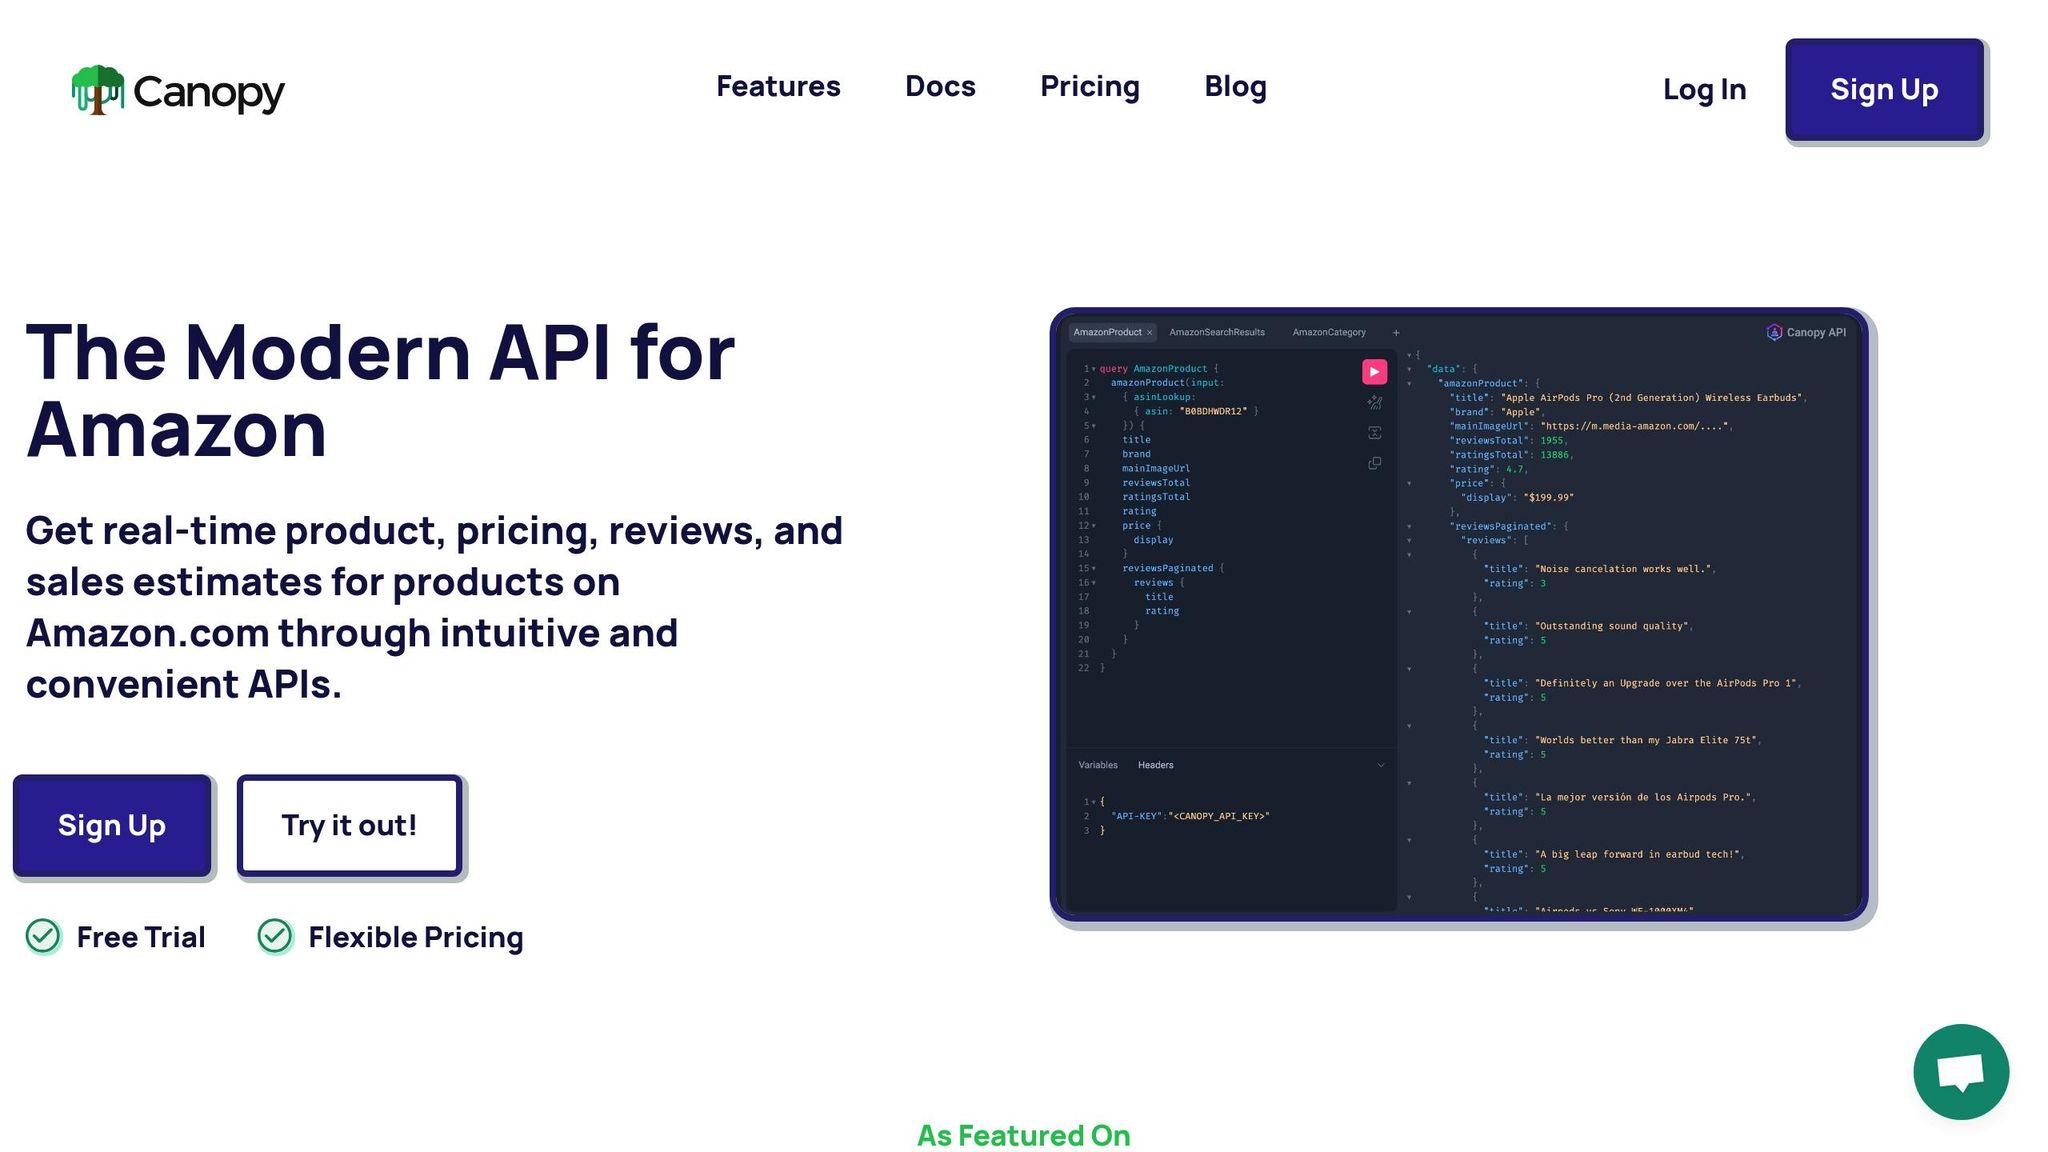
Canopy API redefines how businesses handle Amazon data by providing real-time insights through both REST and GraphQL interfaces. Unlike older methods that rely on delayed updates or manual tracking, this API gives instant access to critical data like search rankings, pricing, inventory, and sales across multiple Amazon marketplaces.
The API offers a range of pricing options, from a free tier to premium plans designed for high-volume needs. This tiered structure ensures businesses of all sizes can benefit, without requiring hefty upfront costs.
With multi-domain support, Canopy API enables monitoring across Amazon marketplaces worldwide, including the US, UK, CA, DE, FR, IT, ES, AU, IN, MX, and BR. The consistent API design means you can use the same integration code across all these regions, simplifying global expansion efforts.
The platform also features AI-powered insights and detailed documentation to eliminate technical barriers. Developers can quickly set up ranking monitoring systems using the OpenAPI specifications and example code available at docs.canopyapi.co.
Next Steps for Implementation
Getting started with Canopy API is simple and delivers immediate value. Here’s how to begin:
- Sign up at canopyapi.co to get your API key. The free tier includes 100 monthly requests, allowing you to test the service and build initial integrations without any upfront costs.
- Explore the documentation at docs.canopyapi.co to learn about the available endpoints. The search endpoint (
/api/amazon/search) is ideal for tracking rankings, while product-specific endpoints provide deeper insights into individual ASINs. For more complex queries, the GraphQL interface at https://graphql.canopyapi.co/ is an excellent option. - Start small by selecting 10-15 key products or search terms for initial monitoring. This targeted approach helps you validate your integration, familiarize yourself with the data, and showcase the value of the API before scaling up. Focus on high-revenue products or those facing tough competition.
- Automate your monitoring schedules to strike a balance between data freshness and cost efficiency. For most businesses, checking rankings every 6-12 hours works well, though you might want more frequent updates during peak shopping events like Black Friday or Prime Day.
- Integrate the data into your existing tools to create actionable dashboards. Combine Canopy API data with your internal sales, advertising, and inventory metrics to uncover trends and opportunities. This integrated view supports smarter decisions across marketing, pricing, and inventory management.
- Plan for the future by setting up data retention policies and alert systems for ranking changes. As your monitoring grows, automated notifications for products slipping below target positions can help you respond quickly and avoid potential losses.
With its real-time insights, flexible pricing, and global coverage, Canopy API is a must-have tool for thriving on Amazon. Whether you’re tracking a small selection of products or managing thousands of ASINs across various categories, this platform lays the groundwork for smarter, data-driven growth in e-commerce.
FAQs
How can businesses use the Canopy API to boost product visibility on Amazon?
Businesses can leverage the Canopy API to track their product rankings on Amazon in real time. By accessing up-to-date search data for specific keywords, they can keep a close eye on how their products are performing in search results and spot opportunities to boost visibility.
This kind of information empowers businesses to make smarter decisions when it comes to refining keyword strategies and improving product listings. With precise and timely data, companies can position their products more effectively, draw in more customers, and ultimately drive higher sales on Amazon.
What are the benefits of using GraphQL endpoints instead of REST with the Canopy API?
The Canopy API supports both REST and GraphQL endpoints, giving you flexibility depending on what your project demands. With GraphQL, you can tailor your queries to fetch exactly the data you need in one request. This approach minimizes API calls and boosts efficiency, particularly when handling complex or deeply nested datasets.
Meanwhile, REST endpoints are straightforward and widely recognized, making them an excellent option for simpler use cases. Deciding which to use comes down to your specific needs, but GraphQL is often the better choice when you require greater control over data structure and retrieval.
How can the Canopy API help track and optimize Amazon rankings during major shopping events like Black Friday?
The Canopy API offers a dynamic way to track real-time Amazon search rankings, making it an essential resource during high-traffic shopping events like Black Friday. By tapping into this API, you gain access to up-to-the-minute data on product rankings, enabling you to spot trends, improve product visibility, and adapt strategies on the fly to outpace competitors.
With the insights provided by the API, you can fine-tune search queries, keep an eye on competitor performance, and position your products to grab customer attention during peak shopping times. This real-time information equips you to make smarter decisions that boost sales and enhance your e-commerce performance.